
In a factory context the implementation of performance indicators is relatively simple for flow-based productions (for example assembly lines), but more complex for department-based productions, due to the large number of managed items making the creation and maintenance of standard times more complex.
Correct management of standard times and methods is one of the primary levers for recovering labour efficiency and is part of our "back to basics" approach.
The article below describes one of the applications of the methodology developed by OPTA to calculate workforce efficiency in a medium-sized company producing hydraulic components.
The project: standard times and methods management
The problem we addressed consisted in the inadequate control of production plants, with particular reference to mechanical processing, carried out using both manually-operated machine tools and automated lines. Specifically, the company in question used a data collection system for the workshop which focused mainly on counting final quantities and processing times, identifying macro-stoppages only.
During a cyclical downturn in sales, the company had highlighted the need to manage its resources more precisely, specifically with regards to labour. After acquiring two machining plants from former suppliers, it became essential to adopt a “scientific” system to calculate the efficiency of labour, in order to make decisions based on real data and to monitor the effectiveness of such decisions.
For the sake of brevity we will concentrate on just one example developed at one of two plants used for mechanical processing. However, the models and methods applied can be adapted to any production configuration.
The project took place over a period of about two months, with a commitment by OPTA consultants of 2-3 days per week: speed of project implementation was considered essential.
- Weeks 1 and 2: definition of cycles and standard times
Having recently acquired the production facility from a former supplier, the company found itself having to define standard times of articles quickly and with sufficient accuracy. For this reason, by applying Times and Methods techniques OPTA developed a mathematical model to define standard production times for each item and work phase.
The model adopted allows cycles and working times to be established for any item, simply by choosing the article type and entering some technical data. This tool is also valid for production planning (workloads) and for estimating product costs.
It’s interesting to note that the parameters used for standard time calculation include the "man / machine ratio", which is key to planning and controlling a departmental production system.
The model was validated through numerous chronometric surveys carried out with the involvement of the plant’s workforce. Such surveys were also used to correct the model and improve its accuracy. From this starting point, times of all work phases were established. Subsequent import of data into the company’s ERP made it possible to avoid manual entry for thousands of lines.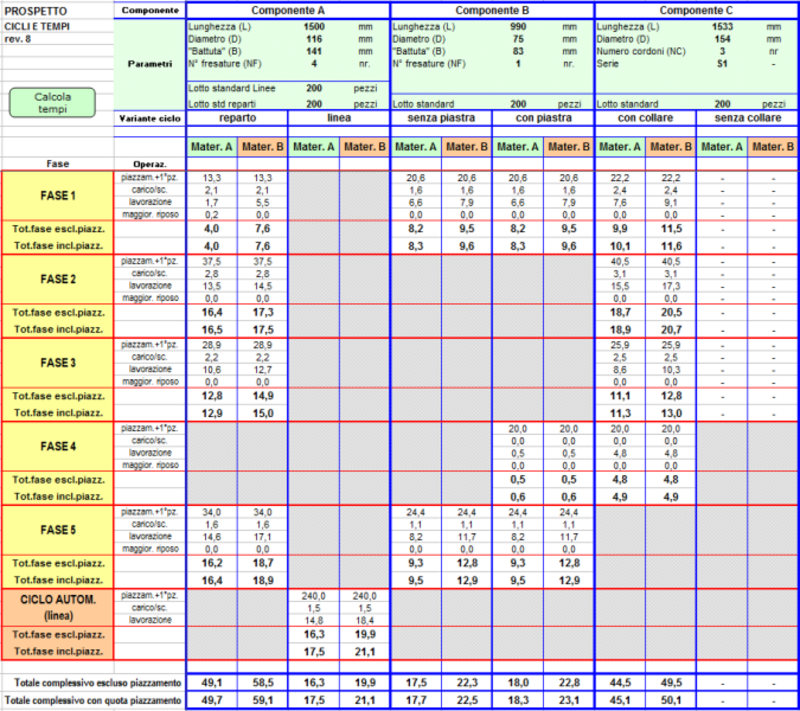 Image 1: OPTA model for defining standard times
- Week 3: creation of data entry form
From the third week, working closely with the plant’s management, a form was created to help workers to record data, to be used until the introduction of electronic data acquisition.
A key innovation introduced with the on-board machine form was the publication of a standard production rate, expressed in various forms to facilitate understanding (minutes / piece, pieces / hour, pieces / shift).
In this way, workers have learned to compare their performance with reference values and to justify any differences, including when involved in a batch production system. The form, specifically, enabled not only the number of pieces produced to be recorded but also a quick check of times (pieces produced at standard time vs at actual time worked) and to report efficiency "losses”, namely all those problems which occurred during the shift, preventing standard times from being achieved.
- Week 4: start of data recording
At the beginning of the fourth week, recordings in the workshop began. Training meetings were held for the workers involved, in order to ensure the correct use of the forms and to explain the purpose of the data recordings.
The causes of efficiency loss that operators could indicate included "Incorrect standard time": in this type of project it is never appropriate to "stress" standard times to obtain efficiency-enhancing results: on the contrary, the definition of easily sustainable and transparent standards is the key to success. In fact, since the opportunities for improvement are hidden in losses and micro-stoppages, it is counter-productive to define production standards which are not easily sustainable.
Note: the next step in what we have described is to computerize data collection, paying attention to the full software specifications and capabilities. Not infrequently, such tools are introduced in a company only to be used at below their full potential.
- Week 5: definition of data analysis model
In this phase, in agreement with management, a set of indicators was defined for evaluating production efficiency. OEE (Overall Equipment Effectiveness) was chosen as the main indicator: it provides a global indication of workshop capacity to produce output with available production resources.
Another indicator which proved of interest was that measuring the use of direct labour, which objectively highlighted the poor management of personnel in departments and the degree of saturation (key elements in times of low production).
- Week 6: development of analysis tool
Based on the set of indicators, a table for data analysis was developed ad hoc on a spreadsheet. The application, which interfaces with the management system for importing data, allows for numerical and graphical views. We want to underline how the main results have been posted on the bulletin board and, where appropriate, have been discussed and analysed together with workers. This aspect is essential: in many measurement systems, workers are not aware of data collected in processes which involve them.
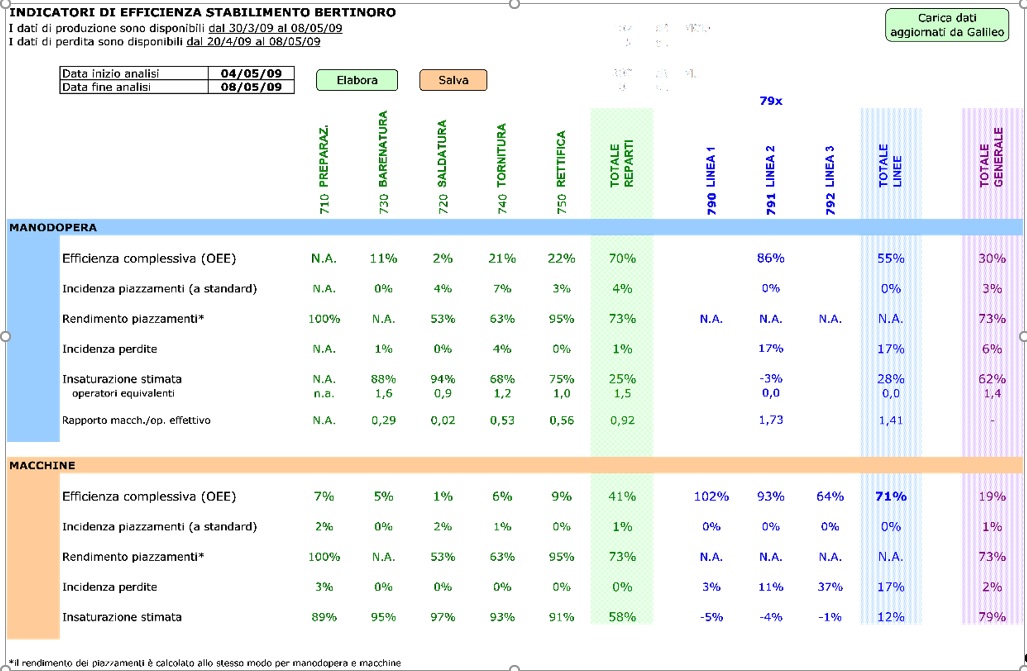 Figure 2. Prospectus for efficiency analysis: numerical dashboard developed by OPTA
- Start monitoring and sharing with management
Two weeks after the start of registrations, the quality of available data was judged adequate for beginning the monitoring of workforce efficiency and subsequent decision-making. An overall picture of the plant thus emerged: it highlighted an excessively low saturation of the workforce. This was caused both by a programming approach which was no longer suited to the workload of the most recent period, and to the presence of efficiency losses whose impact was underestimated by the plant manager. For this reason, a different schedule of activities was set up in order to eliminate the wastage brought to light through this control system. These decisions have led to a 24% increase in labour efficiency.
WHAT VALUE FOR THE COMPANY?
Beyond operational decisions taken in final phases, we can state that we have enabled the company to keep track of its own efficiency and to autonomously decide which adjustments are appropriate from time to time. This objective was achieved in a reasonably short time and with a good degree of accuracy in defining standard times. In fact, the modelling of methods and production times has allowed the solution of one of the major problems linked to the creation and maintenance of standard times in batch production and in productions with numerous items. Moreover, the modelling phase was of high added value since it was an opportunity for discussing both “Times & Methods” approaches and the plant itself: this discussion was experienced by workers in a constructive way. Now a new challenge awaits the company: are current working methods and the relative standard times the best possible? We are working with the company to analyse departmental management and study how to streamline an important part of production.
Article written by Matteo Lombardi


